A BETTER WAY OF
TROUBLE SHOOTING ESSBASE LOGS
The Goal of this blog is to give some useful information
regarding Essbase logs produced through EPM system. Identifying the correct log
file and looking into the error it’s really a critical task and time-consuming
as well. Considering this Oracle has released the log analysis utility with
11.1.23 version.
This utility automates log file & you do not need to
manually locate and scan EPM System log files to identify issues.
Log
Analysis provides a couple of log parameters and you can find this utility
under below path
E:\Oracle\Middleware\user_projects\epmsystem1\bin

Once
running this utility, it will create a summary report in HTML format for all
the log files under below folder
E:\Oracle\Middleware\user_projects\epmsystem1\diagnostic\reports
There
are different logging levels and different parameters available with log files
- Trace-Most intensive logging
- Error-Should be investigated
- Warning-Might be an issue
- Notification-Routine Messages
loganalysis.bat -system
Message Type -m [ERROR | INCIDENT_ERROR |WARNING |
NOTIFICATION | TRACE]]
Time range [-t [<TIME FROM > <TIME TO] -tday <days> - hour
<hours>
·
You may also see error occurred in last 2 hours
or 60 minutes
o Time
in minutes -tmin
<minutes>
o Example
{-tim 45}
·
You may also investigate Errors that occurred today,
so we need to pass -tday
1
·
A String (-s): If you also like to figure
out errors on certain string, then you need to pass -s “out of memory”.
·
Example: loganalysis -s "Failed to
connect to DB" -o DB Connection
Errors" creates a report with
the title DB Connection Errors.html.
The command here I used:
D:\Oracle\Middleware\user_projects\epmsystem1\diagnostics\logs\essbase
and run a report for any ERROR and INCIDENT_ERROR types generated within the
last day.
Sample
Report Output
The tables in this section
provide information about ERROR & INCIDENT_ERROR log

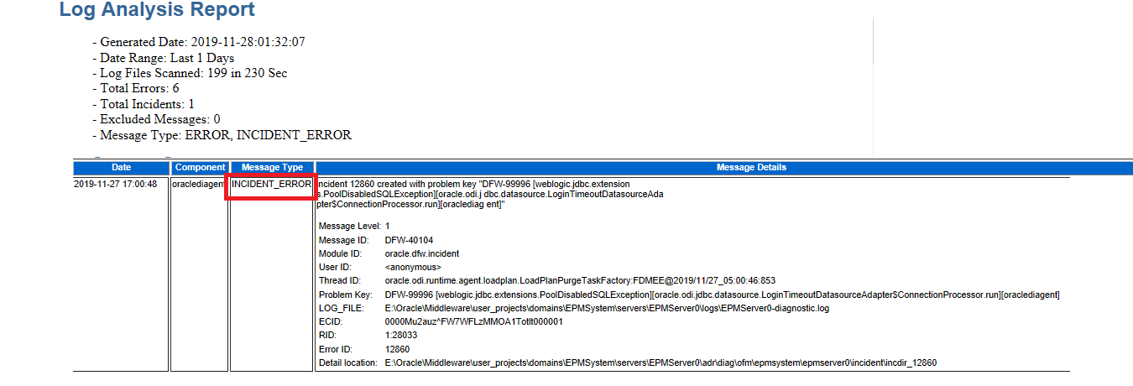
Running a similar report against the Essbase server logs
highlights issues with the database connection.

loganalysis.bat -system -tday 1 -d D:\Oracle\Middleware\user_projects\domains\EPMSystem\servers\EPMServer0\logs
The tables in this section
provide information about ERROR log

The report also includes all the logs files which have been
processed.

The utility has functionality to allow searching for a
string using the –s parameter which I gave a quick test to search for the
following “Out of memory” error:


Unfortunately, the utility did not pick up the error as it
does not seem to search the supplemental detail in the log entry.
loganalysis.bat -functional -s "Application [PLANS]
started"
-d D:\Oracle\Middleware\user_projects\epmsystem1\diagnostics\logs\essbase

The tables in this section
provide information about NOTIFICATION log


